Kafka Connect – Offset commit errors (II)

In the last post, we examined the problem in detail, established a hypothesis for what the issue might be, and validated it with multiple metrics pointing in the expected direction.

However, I intentionally left out any suggestion for a solution, although the investigation would have given us some hints on what we can do. In this post, we look at possible solutions and the pros/cons of each one.

Controlling the flow at Debezium

As discussed in the previous post, Debezium has a number of configuration settings that influence how the Connector pre-fetches MySQL data changes and convert them into SourceRecord objects and how they are delivered to Kafka Connect when it calls poll on the connector:

SettingDefaultDescription
max.queue.size8192Max number of pre-fetched records, awaiting to be polled by Connect
max.batch.size2048Max number of records delivered in every call to poll

On the pro side, it is easy to imagine that if we restricted these two values, it would be possible to reduce the amount of data that flows from Debezium to Connect. However, on the cons side, it would be tough to configure them in a way that produces a deterministic reduction of the number of outstanding messages.

Bear in mind that, as we saw in the last post, Connect constantly calls poll, even before the previous batch of records has been acknowledged. Therefore, I expect that if we were to reduce max.batch.size to 1024, the only result we would obtain is more calls to poll from Connect while still filling the outstanding messages queue.

Think about the flow:

  1. poll returns 1024 records.
  2. Connect puts these records in the outstanding message queue.
  3. Connect sends these records with the KafkaProducer.
  4. KafkaProducer puts those records in its internal queue immediately.
  5. Connect finishes the loop and starts a new one, calling poll again.

Therefore, returning fewer records in each poll call would only slow down temporarily the queue getting filled up.

That said, if we were to also reduce max.queue.size to 1024, it would force Debezium to cross the network for every call to poll. Debezium would have to reach out to MySQL to read more records to satisfy every poll; that would definitively have an impact. However, with the default Kafka Producer settings, it is most likely that one fetch from MySQL would provide many more records than they fit in a single produce request, keeping the Kafka producing phase as the overall bottleneck end to end.

In any case, we do not want to solve the offset commit errors problem by reducing the overall system performance. That would just open the door for other issues.

Limiting the outstanding message queue

Since the root of the problem is how many records are accumulated in the outstanding message queue, one might think that limiting this queue should be the primary solution to the problem. Unfortunately, there is no setting to limit the size of this queue, and the implementation used (IdentityHashMap) is not bound either.

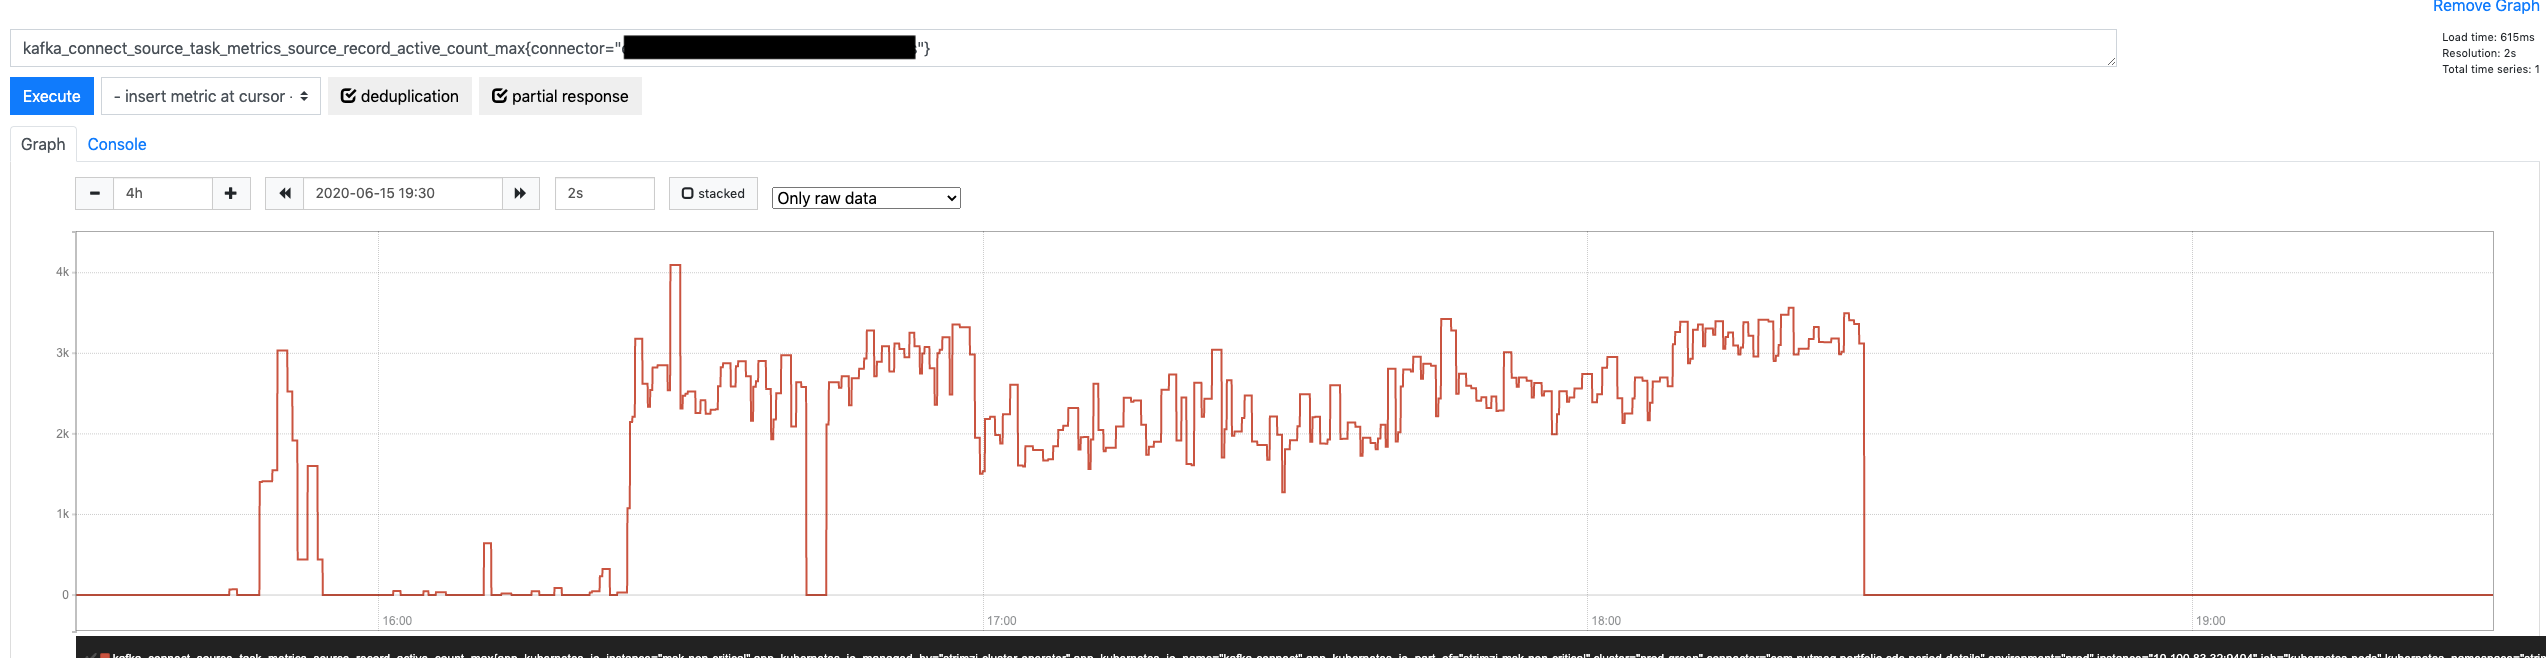
However, if we look at the graph for the source-record-active-count-max metric again, we might notice that the number of active records eventually hit the ceiling and didn’t keep growing.

Source Record Active Count Max

Doesn’t that mean that it is effectively bound? Yes, but not đŸ™‚

It is bound in the sense that there is something that prevents it from growing ad infinitum, but that is more of a happy coincidence that a proper mechanism. What is happening is this:

  1. Records returned by poll are put on the outstanding message queue.
  2. Those same records are passed, one by one, to KafkaProducer‘s send method.
  3. The send method places them in its internal queue and returns immediately.
  4. If the KafkaProducer queue is already filled up, send doesn’t return; instead, t blocks until there is space in the queue.

That is precisely why the outstanding queue doesn’t grow any further. It is not because it is implicitly limited; it is because the SourceWorkerTask blocks calling send once the KafkaProducer queue is filled up. When that happens, it can’t call poll anymore, and it does not add more records into the outstanding queue.

Another metric can confirm this assumption: KafkaProducer metric for available bytes in its internal queue (buffer-bytes-available)

Producer Buffer Bytes Available

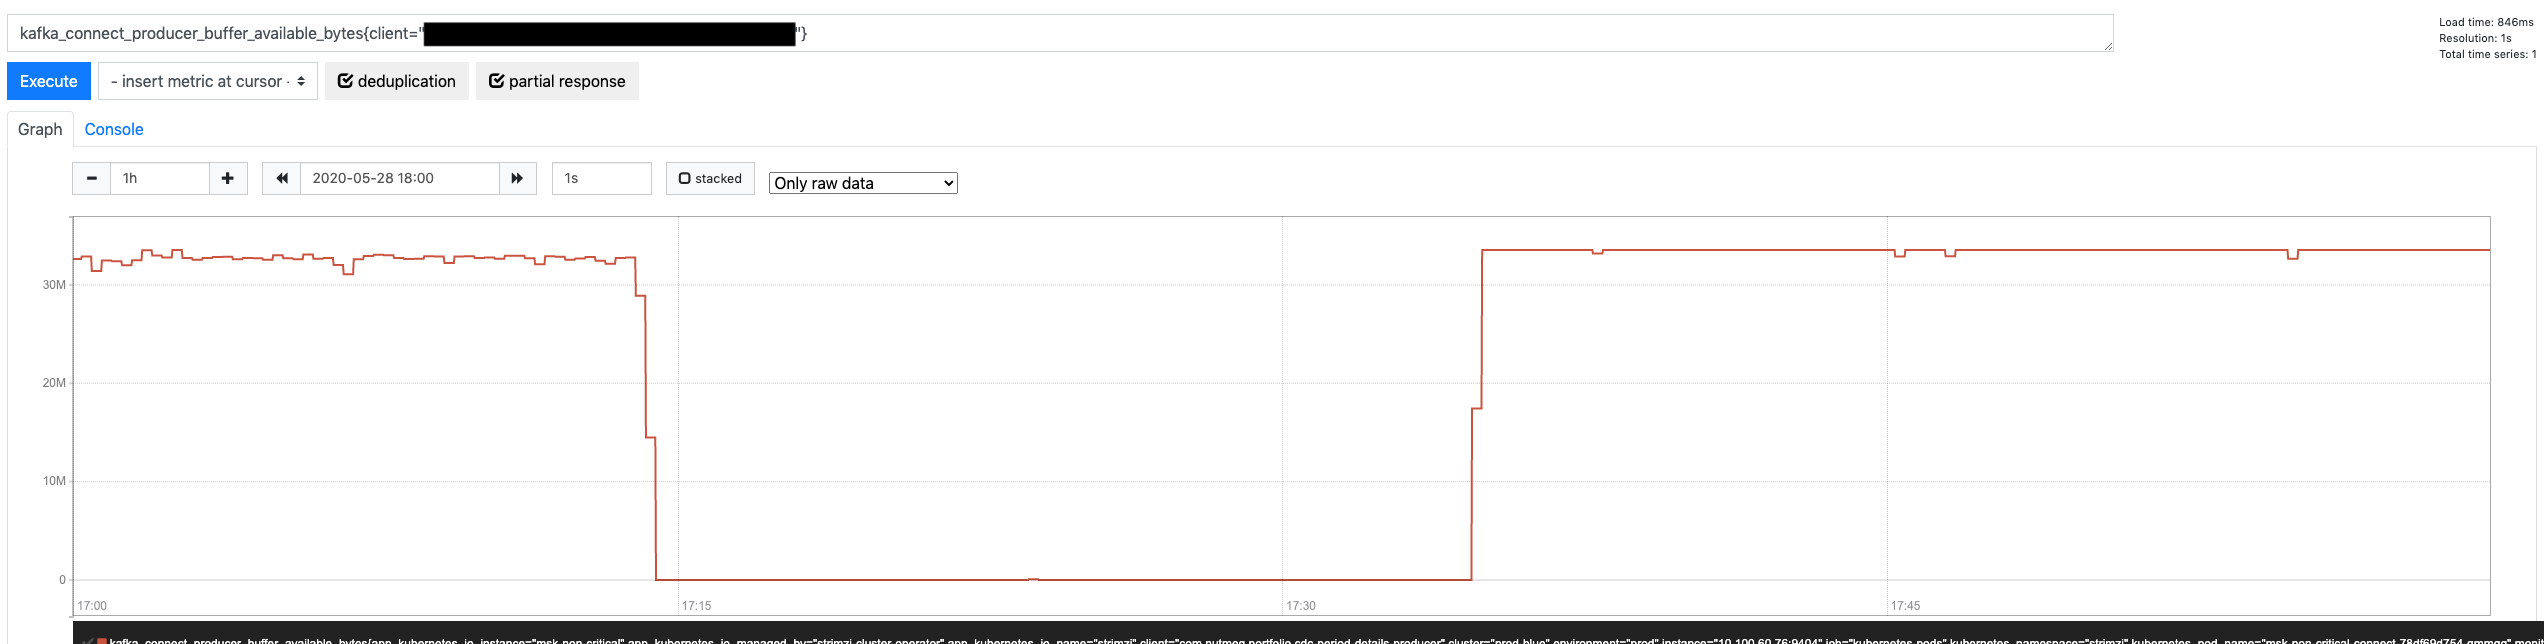
Therefore, we could significantly reduce the size of the outstanding message queue if we reduce the size of the KafkaProducer internal queue, blocking earlier and stopping the SourceWorkerTask from polling more records. The KafkaProducer buffer.memory property does precisely that (defaults to 32 MB). If we reduce its size 50%, it would indirectly cause a similar reduction in the outstanding message queue.

Is this the best strategy, though? While it is the most effective to attack the heart of the problem (the outstanding message queue growing uncontrolled), it is not exempt from problems:

  • While there is a relationship between the KafkaProducer internal buffer and the outstanding message queue, they are not 100% correlated. The KafkaProducer buffer is measured in bytes, while the queue is in number of records. Therefore, their relationship is determined by the size of the consumed records. Depending on the nature of the table, those records could be either fixed in size or vary wildly (e.g., JSON columns)
  • For a more fine-grained tuning of the outstanding queue size (beyond reducing it 50%), the buffer.memory would again have to take an average of the record size into account.

All in all, it is definitively something to consider, but not the first option.

Unlocking more throughput in the Kafka Producer

I started the previous post with a bold statement:

Intuitively, one might think that Kafka will be able to absorb those changes faster than an RDS MySQL database since only one of those two systems have been designed for big data (and it’s not MySQL)

If that is the case, why is the outstanding message queue growing? Admittedly, the queue should never fill up or do it in reasonably at least. Well, the default settings for KafkaProducer optimize sending records to multiple topic/partitions across different brokers at the same time (i.e., applications writing to various topics with multiple partitions each), with multiple concurrent requests (up to 5 by default).

However, for a Debezium connector, we usually:

  • Produce to one single topic at a time (especially if the connector is ingesting a table with a lot of traffic)
  • Produce to topics with one single partition (to guarantee strict order based on the original’s table activity in the binlog)
  • By design, limit in-flight requests to 1 (again, for ordering reasons)

Therefore, we have a completely different scenario where the KafkaProducer default settings result in really poor performance. As we saw in the previous post, we are sending around 25 records per request. Compare to the 8192 records that can pile up in its internal queue and think how many network roundtrips we need to send all of those records.

The first solution to attempt here is to configure the KafkaProducer to unlock Kafka’s performance. The good news is we don’t have to do anything too complicated. Only 25 records make it to every request because every batch is, by default, limited to 16384 (see batch.size property). What happens if we were to apply an x20 factor to this property?

  1. Every network roundtrip would carry x20 more records (500)
  2. Records would be acknowledged faster and removed from the outstanding message queue
  3. By the time a commit offset kicked in, there would be fewer outstanding records, AND the KafkaProducer would be able to deliver x20 faster whatever records were pending, within the default 5-sec timeout

Since Kafka Connect 2.3 implemented the option for connector level configurations for KafkaProducer, it is possible to use them in two steps:

  1. Enable them in your Kafka Connect deployment (https://kafka.apache.org/24/documentation.html#connectconfigs): connector.client.config.override.policy = all
  2. Configure the producer settings in the connector configuration using the producer.override prefix: producer.override.batch.size = 327680

Increasing batch.size: the aftermath

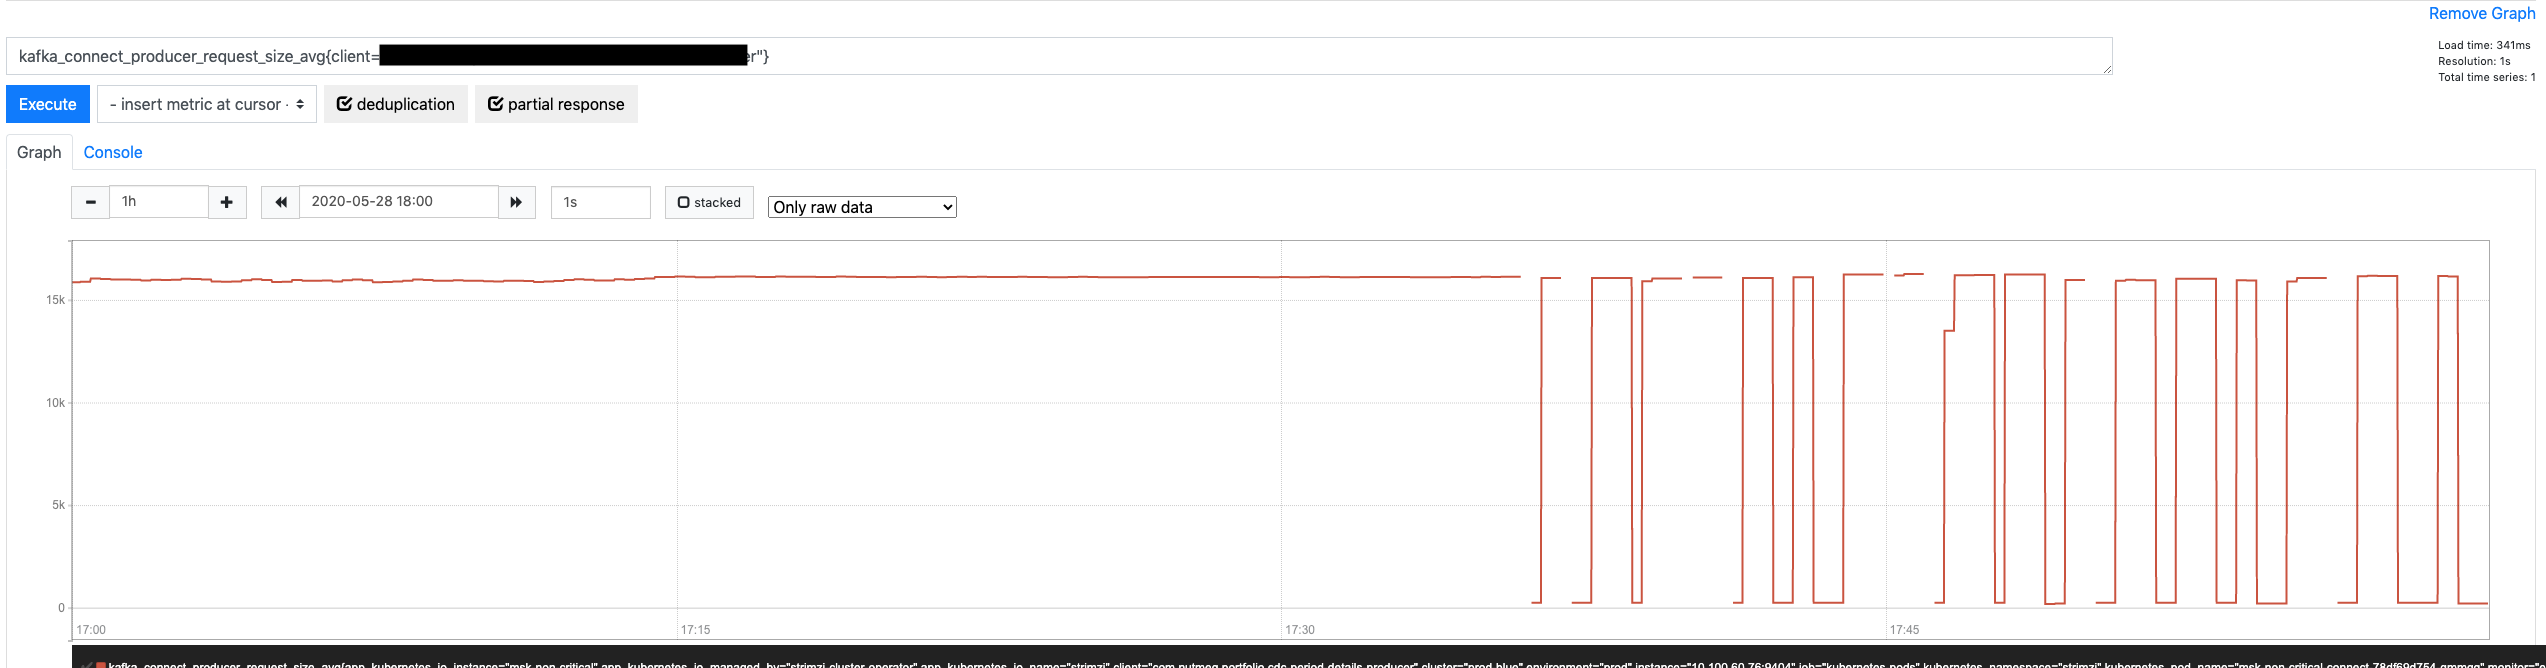
What is the effect of this config change? Very significant. Let’s start with the obvious: more records per request.

Records Per Request after change

As a result of unlocking more throughput per request, the KafkaProducer in-memory buffer isn’t filling up anymore.

Producer Buffer Memory after change

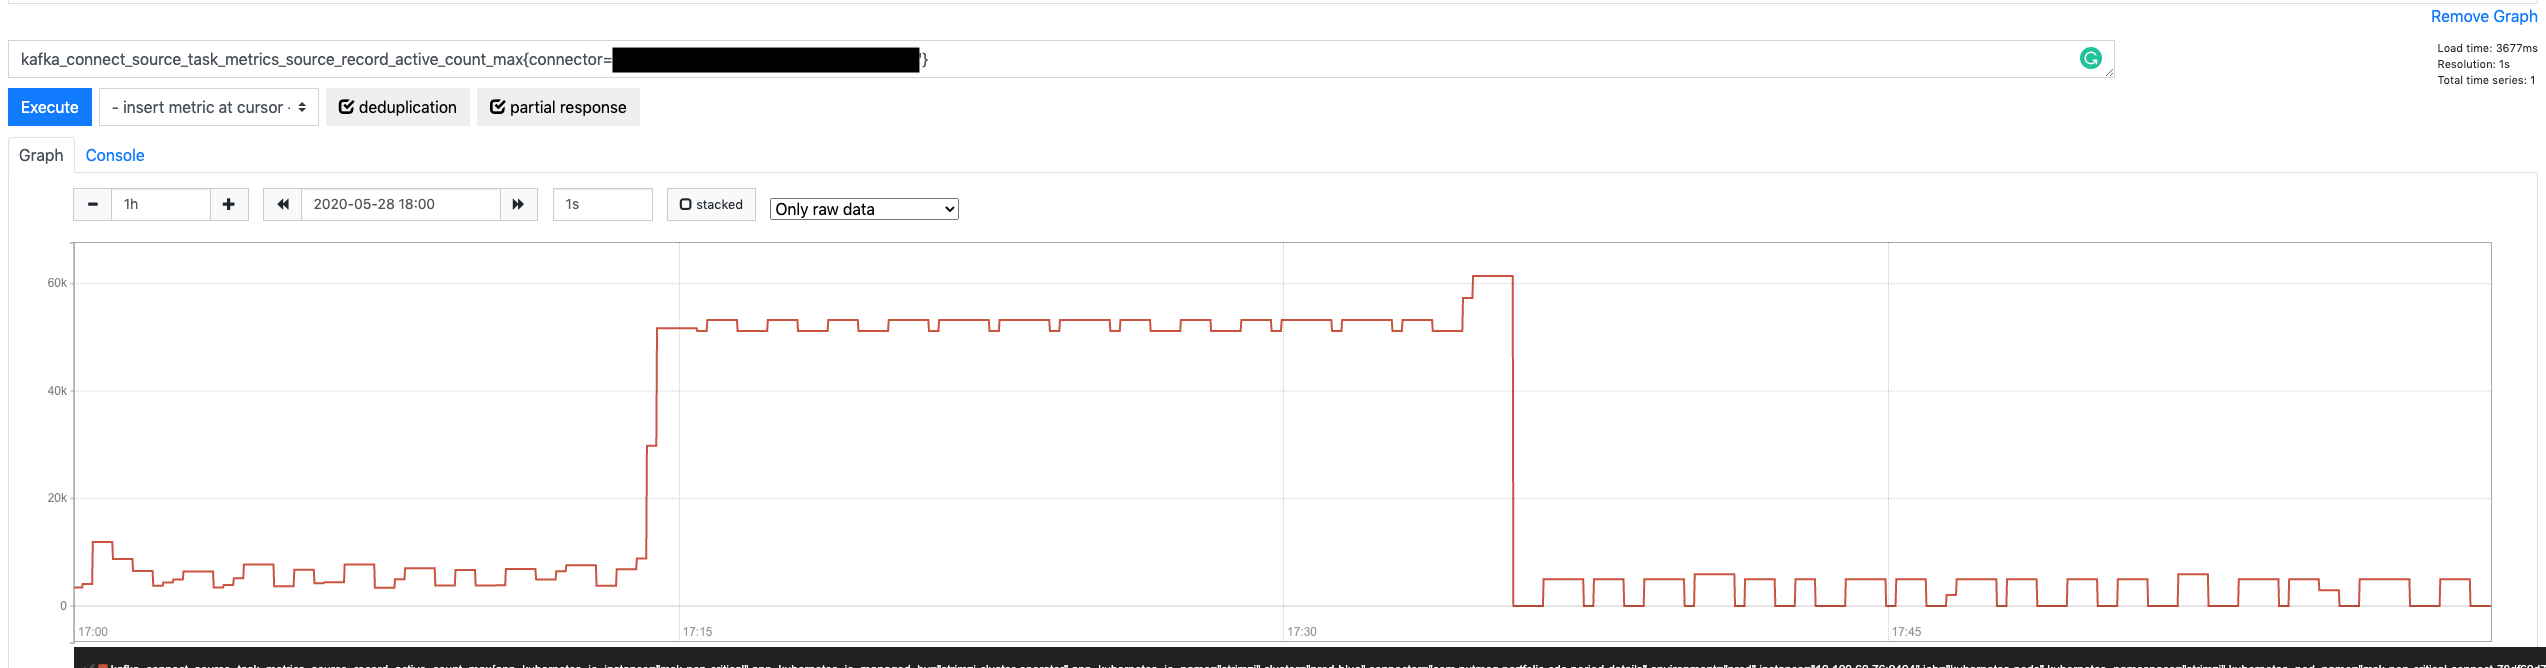
That looks all good, but how is more throughput affecting the Connector? Is it fixing anything there? Let’s look at the number of outstanding messages.

Connector Active Record Count after change

Very promising. On average, the queue is approximately 20x smaller (from peaking at around 60,000 pending messages down to 2,000 – 3,000). Admittedly, this is going to help a lot with the commit offset errors since fewer pending records mean more chances to empty the queue within the offset timeout, but is it enough? Let’s look.

Connector Offset Commit Errors after change

Perfect! Zero errors when committing offsets while the Connector is going through a maximum load period. What is even better, there is a massive margin before committing offsets would take long enough to cause an error. We just need to look at their maximum latency.

Connector Offset Commit Max Time after change

Peaking at 60 ms per request is quite good!

Conclusion

While controlling Debezium flow and restricting how large the outstanding message queue could grow (albeit indirectly) were promising strategies, going back to the basics was the best strategy.

Kafka is designed to be faster and more available than any relational database in the market (with similar hardware). That is a bold statement, but a safe one: Kafka does not do any of the great things that make relational databases so useful. It is a more straightforward system that does one thing well: ingest data at maximum speed. With that in mind, it was a matter of tweaking the right config settings to unlock its power.

That said, be aware of any modifications that you do to Kafka settings in either the client or the server-side. As it usually happens with complex, distributed systems, there might be unexpected side effects. As a general rule, as much as possible, aim to test any change in controlled environments before rolling out to production.

Kafka Connect – Offset commit errors (I)

In this post, we discuss common errors when committing offsets for connectors under load and how we can assess where the problem is, looking at Kafka Connect logs and metrics.

The Context

As part of its strategy to move into an Event-Driven Architecture, Nutmeg uses heavily Kafka Connect and Debezium to capture changes in data stored on various databases, mostly coming from legacy services. That has proven very effective to kick-start EDA systems without costly up-front investment on those legacy services.

Some of these data changes come from batch-oriented services that will kick in once a day and write heavily into the database at maximum capacity (quite frequently limited only by the EBS volume bandwidth). That, in turn, creates a considerable backlog of changes from the Debezium connector to ingest and publish to Kafka.

Intuitively, one might think that Kafka will be able to absorb those changes faster than an RDS MySQL database since only one of those two systems have been designed for big data (and it’s not MySQL). However, distributed systems are complicated beasts, and the unexpected should be, always, expected.

The Error

Every day, when one of those batch-oriented, heavy writers, was hammering the MySQL database, we would eventually get log entries coming from the connectors like this:

INFO  WorkerSourceTask{id=my-connector-0} Committing offsets (org.apache.kafka.connect.runtime.WorkerSourceTask) [pool-16-thread-1]
INFO  WorkerSourceTask{id=my-connector-0} flushing 48437 outstanding messages for offset commit (org.apache.kafka.connect.runtime.WorkerSourceTask) [pool-16-thread-1]
ERROR WorkerSourceTask{id=my-connector-0} Failed to flush, timed out while waiting for producer to flush outstanding 31120 messages (org.apache.kafka.connect.runtime.WorkerSourceTask) [pool-16-thread-1]
ERROR WorkerSourceTask{id=my-connector-0} Failed to commit offsets (org.apache.kafka.connect.runtime.SourceTaskOffsetCommitter) [pool-16-thread-1]

Without failure, a significant increase in the number of capture data changes going through the connectors would result in this type of errors. It seemed counterintuitive, though. Kafka is the fastest system here, and the MySQL database server should be the bottleneck; surely, Kafka Connect would be able to commit its offsets under the default timeout (5 seconds by default, see offset.flush.timeout.ms documentation). What was going on?

Looking Under the Hood

Before knowing why the process was failing, we need to look under the hood to understand what is happening. What does Kafka Connect do? A picture is worth a thousand words:

Kafka Connect commit process

OK, maybe this does not entirely settle it, let’s look at it step by step:

  1. A Debezium Connector starts (with task.max=1), resulting in one WorkerTask running on a Connect Worker.
  2. This WorkerTask spins out a WorkerSourceTask (Debezium is a source connector) and calls execute on it.
  3. The execute method is, basically, a big while loop that runs indefinitely, unless the task state changes to stop or paused.
  4. In every iteration of the loop, the WorkerSourceTask polls many SourceRecord instances provided by the source connector plugin (Debezium in this case).
  5. Those SourceRecord are stored in a sort of outstanding messages queue, before being provided to a KafkaProducer instance.
  6. Every SourceRecord is then send using the KafkaProducer. If you know how KafkaProducer instances work, they don’t send the record over the network when send returns.
  7. The record is sent eventually. When it gets acknowledged by the Kafka cluster, a callback is involved, which will remove the acknowledged record from the pending queue.
  8. Finally, coming from a different thread, every offset.flush.interval.ms (by default, 60 seconds) the WorkerSourceTask gets its commitOffsets method invoked, which triggers the process that results in the errors seeing the previous section.

Simple, right? Well, maybe not, but hopefully clear enough.

One key point here is that the commit process waits until the outstanding messages queue is empty to proceed. It makes sense, it wants to know what records have been successfully produced to commit their offsets, or whatever reference it is used (e.g., GTID, binlog position).

The Hypothesis

Let’s throw a hypothesis for what might be happening here:

Since committing offsets waits until the outstanding message queue is empty, if acknowledging all of them takes anywhere close to the commit offset timeout (5 sec by default), the commit process will fail. We see these errors because the large number of outstanding messages (48437 in the example) take too long to be published successfully

That sounds reasonable, but can we validate it? And can we do something about it afterward? Let’s see

Validating The Hypothesis

Let’s start by determining if the metrics confirm the errors that we see.

Are offset commits really failing?

Kafka Connect has metrics for everything, including commit offsets failing. That metric is offset-commit-failure-percentage:

Offset Commit Failure %

Unsurprisingly, the metric raises when commit offset failures are reported in the logs.

Are outstanding messages growing?

Next, we should have metrics confirming that the outstanding message queue grows almost unbounded when the connector is under heavy traffic. That metric is source-record-active-count-max (there is also an average version):

Source Record Active Count Max

There it is, an exact correlation between the outstanding message queue getting out of hand and commit offsets failing.

Why can’t Kafka keep up?

One might think: why isn’t Kafka keeping up with delivering records fast enough, so the outstanding message queue doesn’t go so large? Well, there are multiple pieces involved in this part of the process:

  • The KafkaProducer that Connect uses to publish the records to Kafka.
  • The network between the machine running the Kafka worker (K8S node in this case) and the destination Kafka cluster.
  • The Kafka cluster itself, potentially multiple brokers, if there is any replication involved (which it almost always is).

If we start with the KafkaProducer, it is important to notice that it uses a relatively standard configuration. These settings are published when the producer is created (upon task creation). If you have given a specific name to your producer’s client.id, you would see an entry like this in your logs (with many more settings, these below are just the most relevant subset):

INFO ProducerConfig values: 
    acks = all
    batch.size = 16384
    buffer.memory = 33554432
    client.id = my-connector-producer
    linger.ms = 0
    max.block.ms = 9223372036854775807
    max.in.flight.requests.per.connection = 1
    max.request.size = 1048576

From these settings, we can confirm a few things:

  • Requests will need to wait until the record has been replicated before being acknowledged, which would increase the overall request latency.
  • Whatever the number of records awaiting is, a request will only contain up to 16,384 (16K) of records. If every record took 1KB, it would only accommodate 16 records in each network roundtrip.
  • The producer will only send one request at a time. That guarantees order but decreases throughput.
  • Every request can be up to 1MB.

What is the point of having requests up to 1MB if a batch can only be 16KB? The KafkaProducer documentation answers that question:

Requests sent to brokers will contain multiple batches, one for each partition with data available to be sent.

However, this connector is producing to a topic with 1 partition only, meaning the KafkaProducer will not take advantage of the ability to place multiple batches in one single request. Another metric can confirm if this is true: request-size-avg.

Producer Request Size Avg

We have this large request size, but we are only using a fraction of it.

Let’s look at this from a different angle. Based on the size of every record, how many records are we packaging in every request to the broker)? Yep, there is another metric for that: records-per-request-avg

Producer Records per Request Avg

Considering that we are packaging a mere 23 records per request, we would need more than 2,000 requests to flush out that queue as it was reported before trying to commit offsets.

Can we publish data faster?

This connector runs on a Kafka Connect worker sitting on top of a K8S node provisioned as an EC2 m5a.2xlarge instance… How much bandwidth does this family have?

According to AWS documentation, up to 10 Gbps.
However, not everybody agrees with this estimation. It seems up to means mostly a burst that won’t last for more than 3 minutes.
Instead, some put the numbers down to a more realistic 2.5 Gbps for a similar family type.

However, whatever the number, where are we up to really? How much extra bandwidth can the connector use? It is a difficult question for a couple of reasons:

  • It’s not the only connector/task running in the Connect worker. Other tasks require network too.
  • The Connect worker is not the only pod in the K8S node. Other pods will use the network as well.
  • There are also availability zones for both K8S nodes and Kafka brokers, which would have to be taken into account.

However, if we ignore all of this just for one second and we look at how much bandwidth the Connect workers are using (any of them), we can see that none of them are above a quite modest 35 MB/s.

Kafka Connect Workers Bandwidth Usage

That gives us a lot of extra bandwidth until saturating those 2.5 Gbps (i.e., 320 MB/s) for the family type. Yes, the network is shared with other pods in the K8S node, but few of them will be as network-intensive as Kafka Connect.

Can we control the flow at the source?

One could argue that, if Debezium weren’t floading the connector with MySQL data changes, none of this would matter. That is partly true, but not the cause of the problem since the SourceWorkerTask polls records from DBZ whenever it wants.

Debezium has metrics that confirm whether it has records that could provide to the SourceWorkerTask but they haven’t been requested yet: QueueRemainingCapacity

Debezium Internal Queue Remaining Capacity

This metric tells us that Debezium puts SourceRecord instances to the internal queue faster than the SourceWorkerTask is polling them. Eventually, the DBZ queue gets full; when this happens, DBZ doesn’t read more binlog entries from the MySQL database until the queue has some capacity.

Also, DBZ delivers up to max.batch.size (defaults to 2,048) records in every poll request. Since the internal queue is permanently filled up during the period where offset commits fail, it is reasonable to think that every poll will return 2K records, adding a huge extra burden to the list of outstanding messages. Yet another Connect metric (batch-size-avg) confirms this:

Connector Batch Size Avg

Conclusion

After going through all of these graphs and detailed explanations, a few things seem pretty clear:

  1. MySQL/Debezium combo is providing more data change records that Connect / Kafka can ingest.
  2. The connector is building up a large, almost unbounded list of pending messages. That is the result of its greediness: polling records from the connector constantly, even if the previous requests haven’t been acknowledged yet.
  3. Eventually, an offset commit request draws a line in the sand and expects this pending list to be empty. By the time that happens, the list is just too big.
  4. The list grows unbounded because the KafkaProducer is not optimized for throughput. It is carrying just an avg of 23 records per network roundtrip.

The solution? You’ll have to wait for the next post to find out!

References

Apache Kafka monitoring